> ## Documentation Index
> Fetch the complete documentation index at: https://docs.aseeflow.org/llms.txt
> Use this file to discover all available pages before exploring further.
# System Management
The System Settings menu gives you general information about the process engine. It enables users with system permissions to access certain system information, including diagnostics and metrics.
**Accessing the System Settings menu**
The System Settings menu is only usable by users which are granted with *All* permission for authorizations.
## Diagnostics
The **Diagnostics** menu allows you to view and copy diagnostics data about your environment or distribution of ASEE Flow. The main purpose of the **Diagnostics** menu is to increase transparency by giving you easy access to important system diagnostics information. In the event of an issue, this should also improve problem diagnosis by enabling you to quickly understand and share the ASEE Flow environment you are running.
## Execution Metrics
The Execution Metrics menu in Admin displays an approximate number of *Flow Nodes Instances (FNI)*,
*Executed Decision Elements (EDE)*, *Process Instances (PI)* and *Decision
Instances (DI)* processed by the engine and *Task Users (TU)* that were assigned to a
user task by the selected contract start date.
The page displays the rolling last 12 months metrics in a chart and table.
Legacy metrics (FNI, EDE) are hidden by default, but can be displayed by selecting the **Display legacy metrics** checkbox.
Underneath, it displays all the available annual usage metrics.
Annual metrics together with the diagnostics data can be copied to the clipboard by clicking on
the button.
The copied format consists of two parts as seen below in the example.
The second part contains the diagnostics data which provides useful information that helps ASEE Flow to improve support but customers can opt out of sharing it.
This part has been truncated in the example.
```
21/02/2024 up to today
- PI: 1,705,434
- DI: 1,709,410
- TU: 3
- FNI: 1,722,414
- EDE: 1,716,683
{
"installation": "bf32d0f5-43c6-4be4-b45e-de0ef1a48117",
"product": {
"name": "Camunda BPM Runtime",
"version": "{{< minor-version >}}.0",
"edition": "community",
...
}
}
```
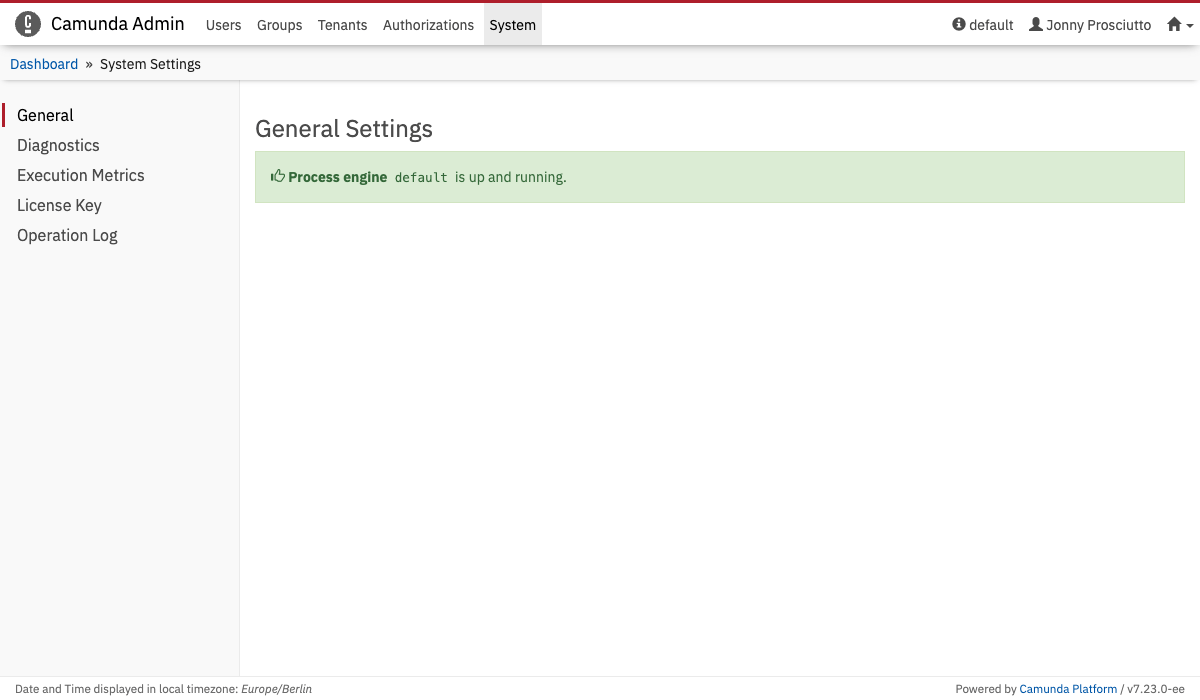 The System Settings menu gives you general information about the process engine. It enables users with system permissions to access certain system information, including diagnostics and metrics.
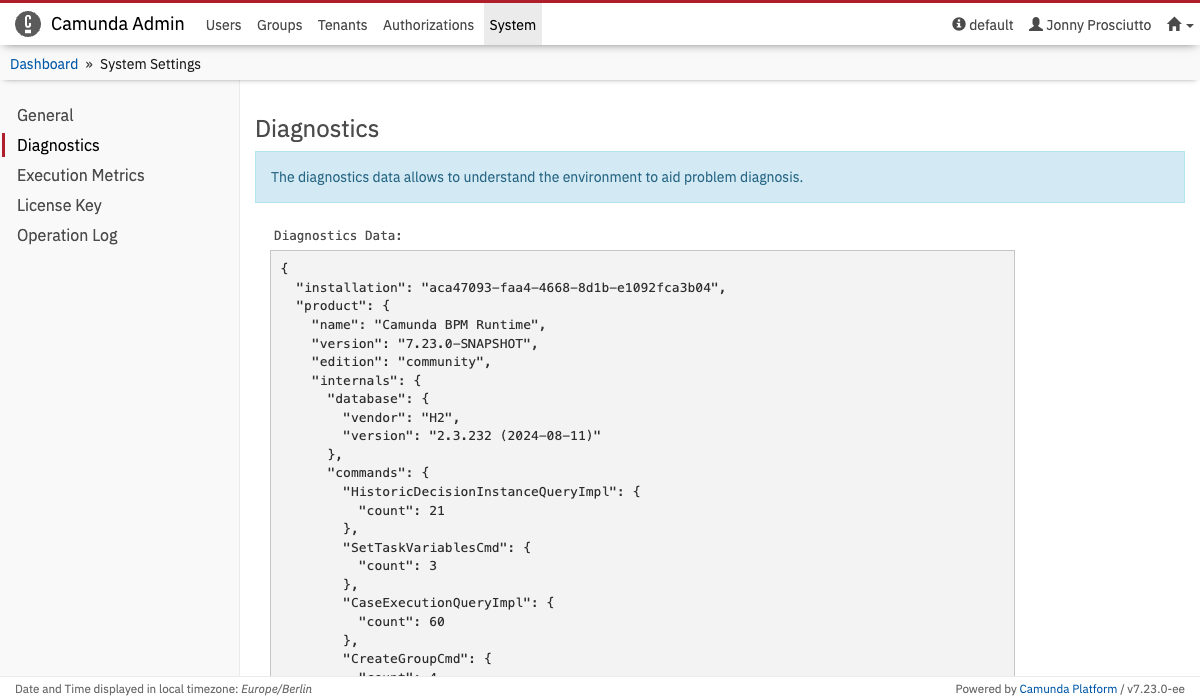 The **Diagnostics** menu allows you to view and copy diagnostics data about your environment or distribution of ASEE Flow. The main purpose of the **Diagnostics** menu is to increase transparency by giving you easy access to important system diagnostics information. In the event of an issue, this should also improve problem diagnosis by enabling you to quickly understand and share the ASEE Flow environment you are running.
## Execution Metrics
The **Diagnostics** menu allows you to view and copy diagnostics data about your environment or distribution of ASEE Flow. The main purpose of the **Diagnostics** menu is to increase transparency by giving you easy access to important system diagnostics information. In the event of an issue, this should also improve problem diagnosis by enabling you to quickly understand and share the ASEE Flow environment you are running.
## Execution Metrics
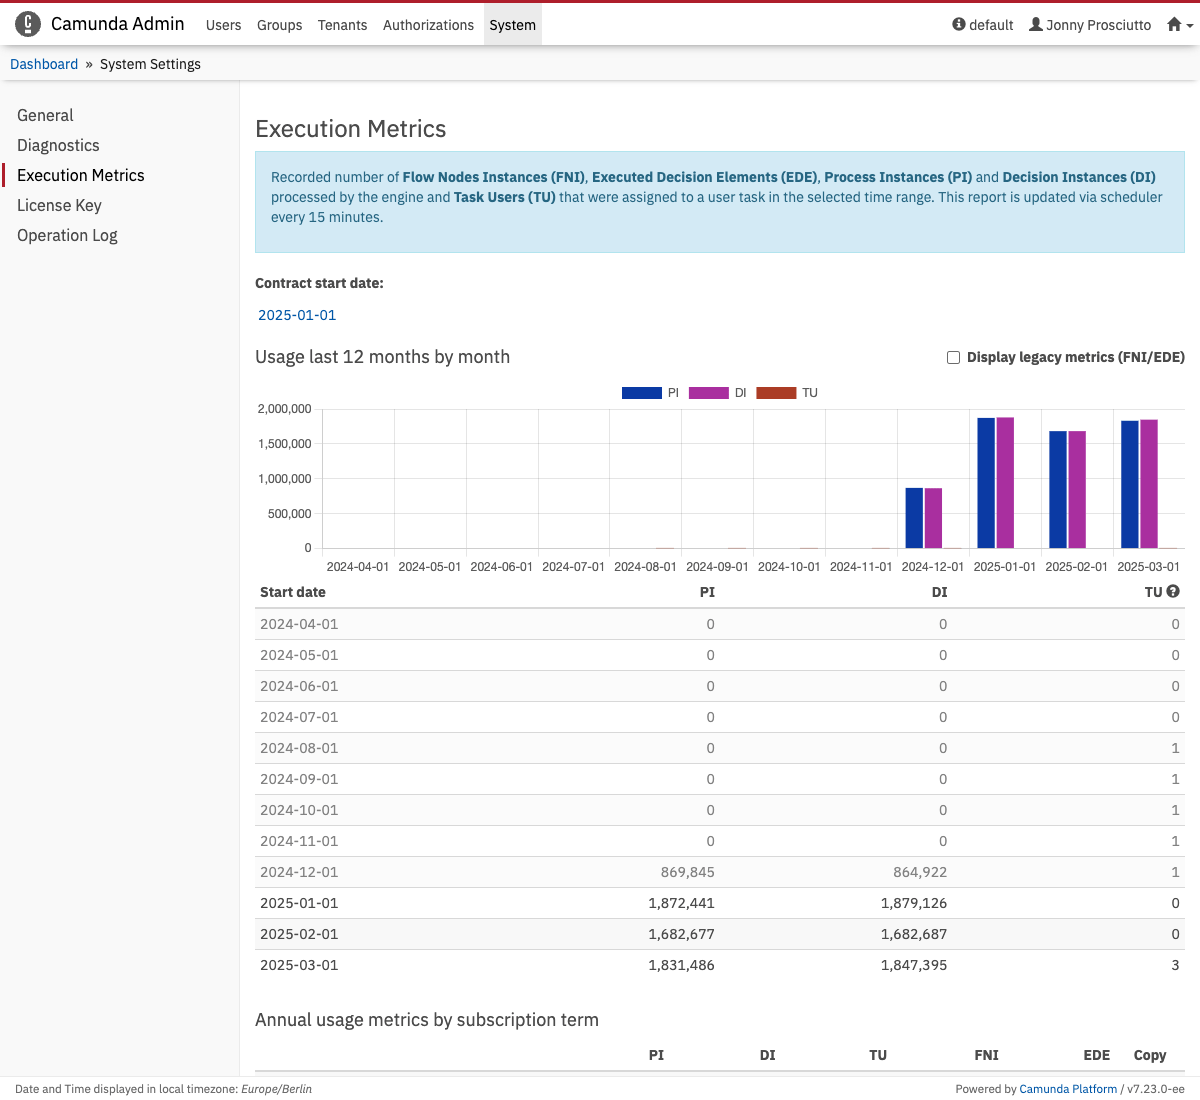 The Execution Metrics menu in Admin displays an approximate number of *Flow Nodes Instances (FNI)*,
*Executed Decision Elements (EDE)*, *Process Instances (PI)* and *Decision
Instances (DI)* processed by the engine and *Task Users (TU)* that were assigned to a
user task by the selected contract start date.
The page displays the rolling last 12 months metrics in a chart and table.
Legacy metrics (FNI, EDE) are hidden by default, but can be displayed by selecting the **Display legacy metrics** checkbox.
Underneath, it displays all the available annual usage metrics.
Annual metrics together with the diagnostics data can be copied to the clipboard by clicking on
the button.
The copied format consists of two parts as seen below in the example.
The second part contains the diagnostics data which provides useful information that helps ASEE Flow to improve support but customers can opt out of sharing it.
This part has been truncated in the example.
```
21/02/2024 up to today
- PI: 1,705,434
- DI: 1,709,410
- TU: 3
- FNI: 1,722,414
- EDE: 1,716,683
{
"installation": "bf32d0f5-43c6-4be4-b45e-de0ef1a48117",
"product": {
"name": "Camunda BPM Runtime",
"version": "{{< minor-version >}}.0",
"edition": "community",
...
}
}
```
The Execution Metrics menu in Admin displays an approximate number of *Flow Nodes Instances (FNI)*,
*Executed Decision Elements (EDE)*, *Process Instances (PI)* and *Decision
Instances (DI)* processed by the engine and *Task Users (TU)* that were assigned to a
user task by the selected contract start date.
The page displays the rolling last 12 months metrics in a chart and table.
Legacy metrics (FNI, EDE) are hidden by default, but can be displayed by selecting the **Display legacy metrics** checkbox.
Underneath, it displays all the available annual usage metrics.
Annual metrics together with the diagnostics data can be copied to the clipboard by clicking on
the button.
The copied format consists of two parts as seen below in the example.
The second part contains the diagnostics data which provides useful information that helps ASEE Flow to improve support but customers can opt out of sharing it.
This part has been truncated in the example.
```
21/02/2024 up to today
- PI: 1,705,434
- DI: 1,709,410
- TU: 3
- FNI: 1,722,414
- EDE: 1,716,683
{
"installation": "bf32d0f5-43c6-4be4-b45e-de0ef1a48117",
"product": {
"name": "Camunda BPM Runtime",
"version": "{{< minor-version >}}.0",
"edition": "community",
...
}
}
```